XDebug Laravel in JetBrain PhpStorm with Valet and PHP Monitor
When it comes to Laravel (or PHP in general) development environments, everybody enjoys using a slightly different setup. Personally, I opted in to use a stack of PhpStorm by JetBrains, Laravel Valet and PHP Monitor which is a neat macOS helper for juggling different PHP versions on one machine developed by talented Nico Verbruggen.
Why XDebug?
Personally, I don’t really use “classic” debuggers - maybe once every 2 years when there’s a really deep issue somewhere I need to figure out. Most of the times, you can avoid using a debugger with PHP alltogether, especially in the Laravel ecosystem that comes with great helpers that are much quicker and much more convenient to use than XDebug.
If you can, avoid using XDebug alltogether. There’s merely a good use case for it.
- Want to see the contents of a variable? Just
dumpit. - Want to see which Listeners or Jobs fired in a request? Just use Laravel Telescope.
- Want to see how a variable changes in a loop? Just use the
loggerhelper. - Want to see your session variables and the XHR call history? Just use
laravel-debugbarby Barry vd. Heuvel.
Those four things will get you 99% of your questions answered even before you have followed this tutorial to use XDebug.
Requirements
As mentioned above, this tutorial assumes that you’re developing PHP on a macOS device with the following stack:
- PhpStorm
- Laravel Valet
- PHP Monitor
If you’re using another stack, this tutorial might not work correctly for your use case.
All of the steps described below need to be carried out for each PHP version you want to use XDebug with.
Install XDebug
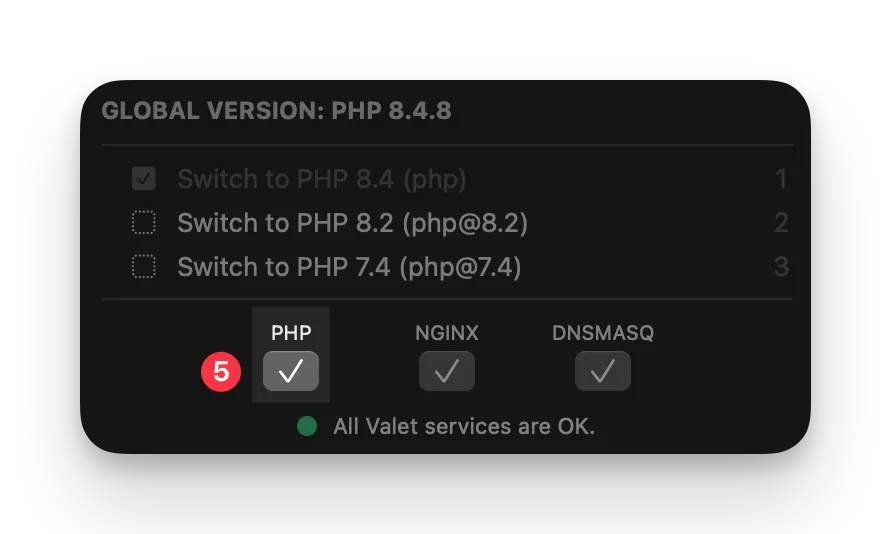
First step is to make sure that you have the XDebug PHP extension installed. To do so, click the PHP Monitor icon in the top bar and select Manage PHP Extensions.
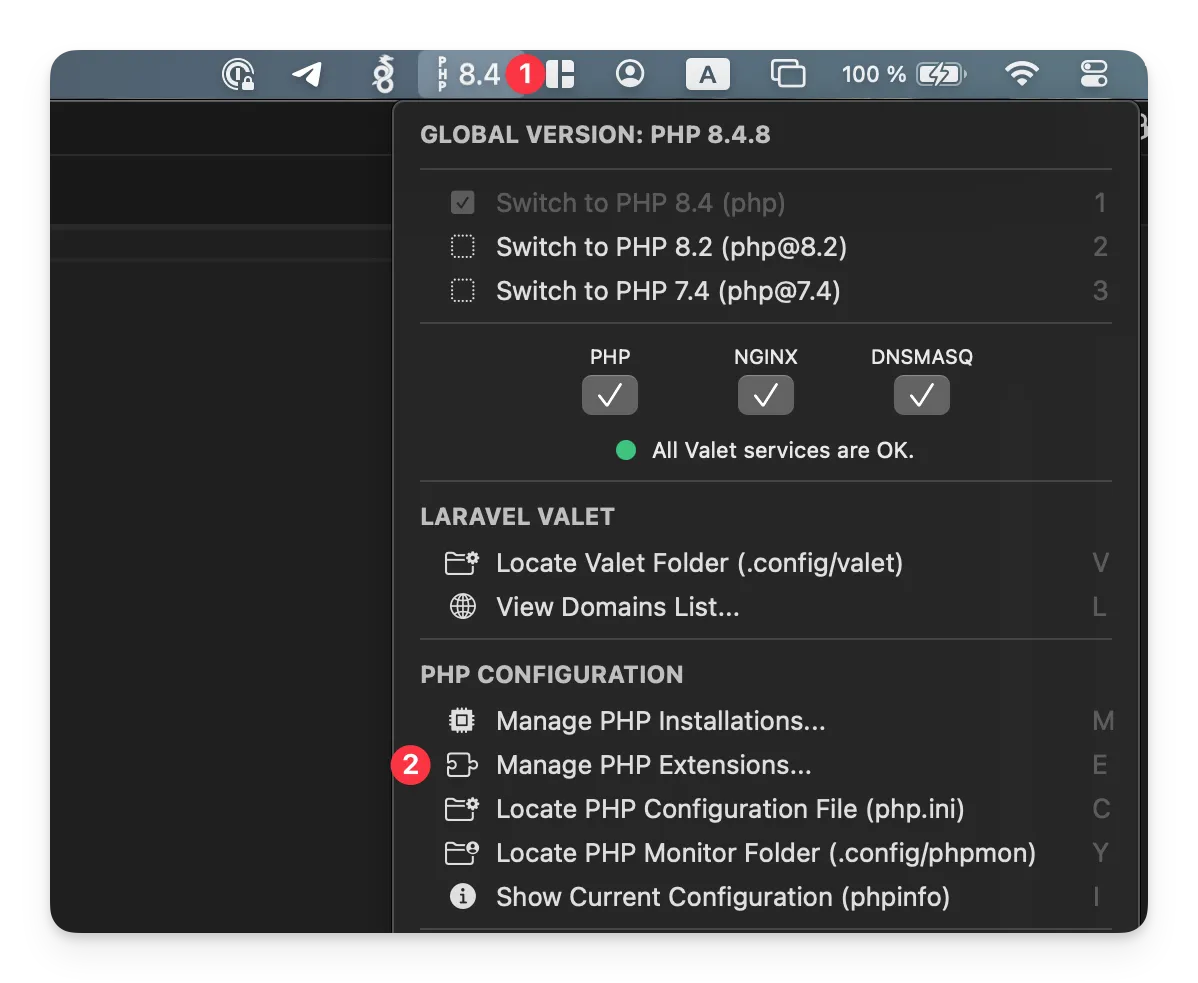
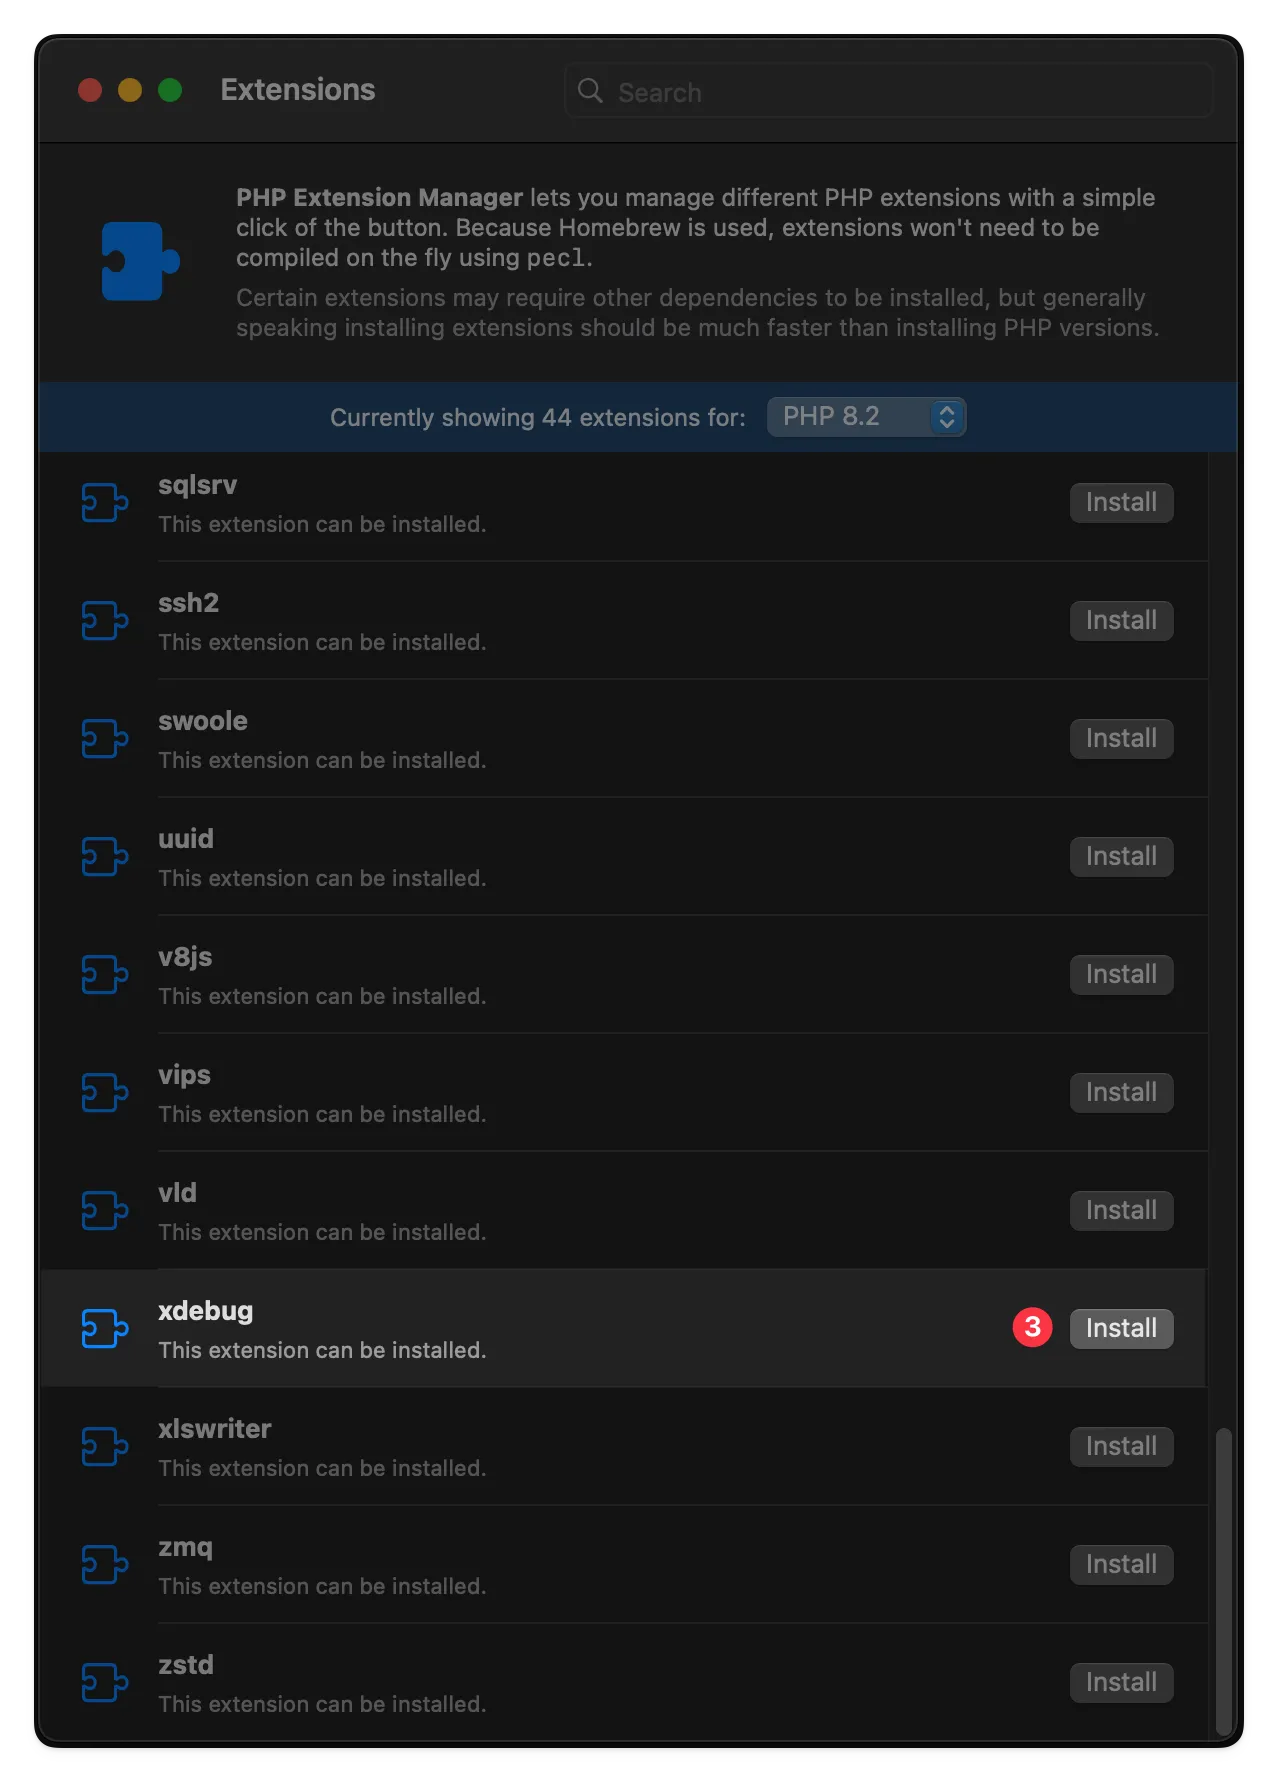
A new window will open that lists all available extensions you can install for your currently enabled PHP version. Scroll down until you find xdebug and click Install. In case the extension is already installed, you’re good to go.
Configure XDebug
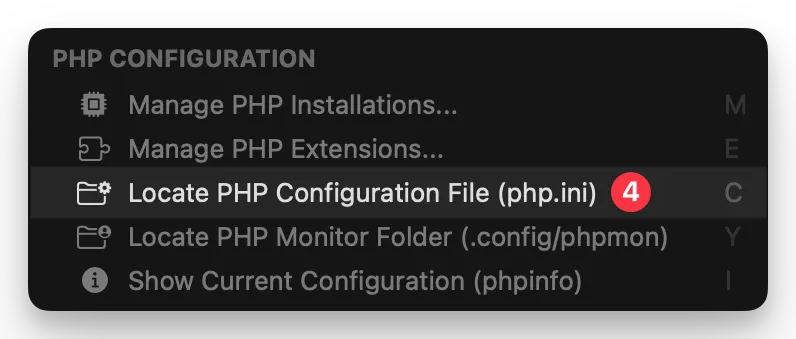
Now that the extension is installed, we just need to configure a few things to make sure it works with PHPStorm. We’re doing this in a separate configuration file to avoid that PHP Monitor messes with the file upon any future update. Head to PHP Monitor again and select the item Locate PHP Configuration File (php.ini) from the dropdown menu.
Take note of the path. By default it should be:
/opt/homebrew/etc/php/8.4/In order to create a new custom configuration for XDebug, you can run the following command:
touch /opt/homebrew/etc/php/8.4/conf.d/99-xdebug.iniReplace 8.4 with the version of PHP you want to configure XDebug for. Then, open the file with a editor of your choice (doesn’t matter whether it’s a visual one or one the command line) and paste the following configuration.
Attention! It’s very important, that you name the file 99-xdebug.ini. This ensures that its evaluation order is after the config file that enables the Xdebug extension. Also, when PHP Monitor changes something in its own Xdebug configuration file, it doesn’t override your own settings.
[xdebug]xdebug.mode=debugxdebug.client_host=127.0.0.1xdebug.client_port=9003xdebug.discover_client_host=1This tells your XDebug extension to go into Debug Mode which allows you to perform step-by-step debugging in PhpStorm. The other three variables are to make sure that XDebug is listening on a well-known set of IP address and port, so that PhpStorm can connect to it in the next step.
In order to activate said changes, you need to restart your php-fpm service. You can do this comfortably with PHP Monitor as well by clicking on the PHP service at the top of the dropdown to stop it and then clicking on it a second time to start it again.
Configure PhpStorm
Now that XDebug is properly configured, we can continue the setup in PhpStorm. Open the PhpStorm settings and locate the Debug section under the PHP category.
First of all, I’d recommend making the following changes to the default config:
- Disable Break at first line in PHP scripts
- Disable Force break at first line when no path mapping specified
- Disable Force break at first line when a script is outside the project
This will make sure that your PhpStorm won’t open several debugging sessions when there are sub-requests made to your application that are out of scope of your debugging plans, like e.g. the requests the Laravel Debugbar makes to retrieve session and application information. You don’t want those to trigger a step-by-step debugging.
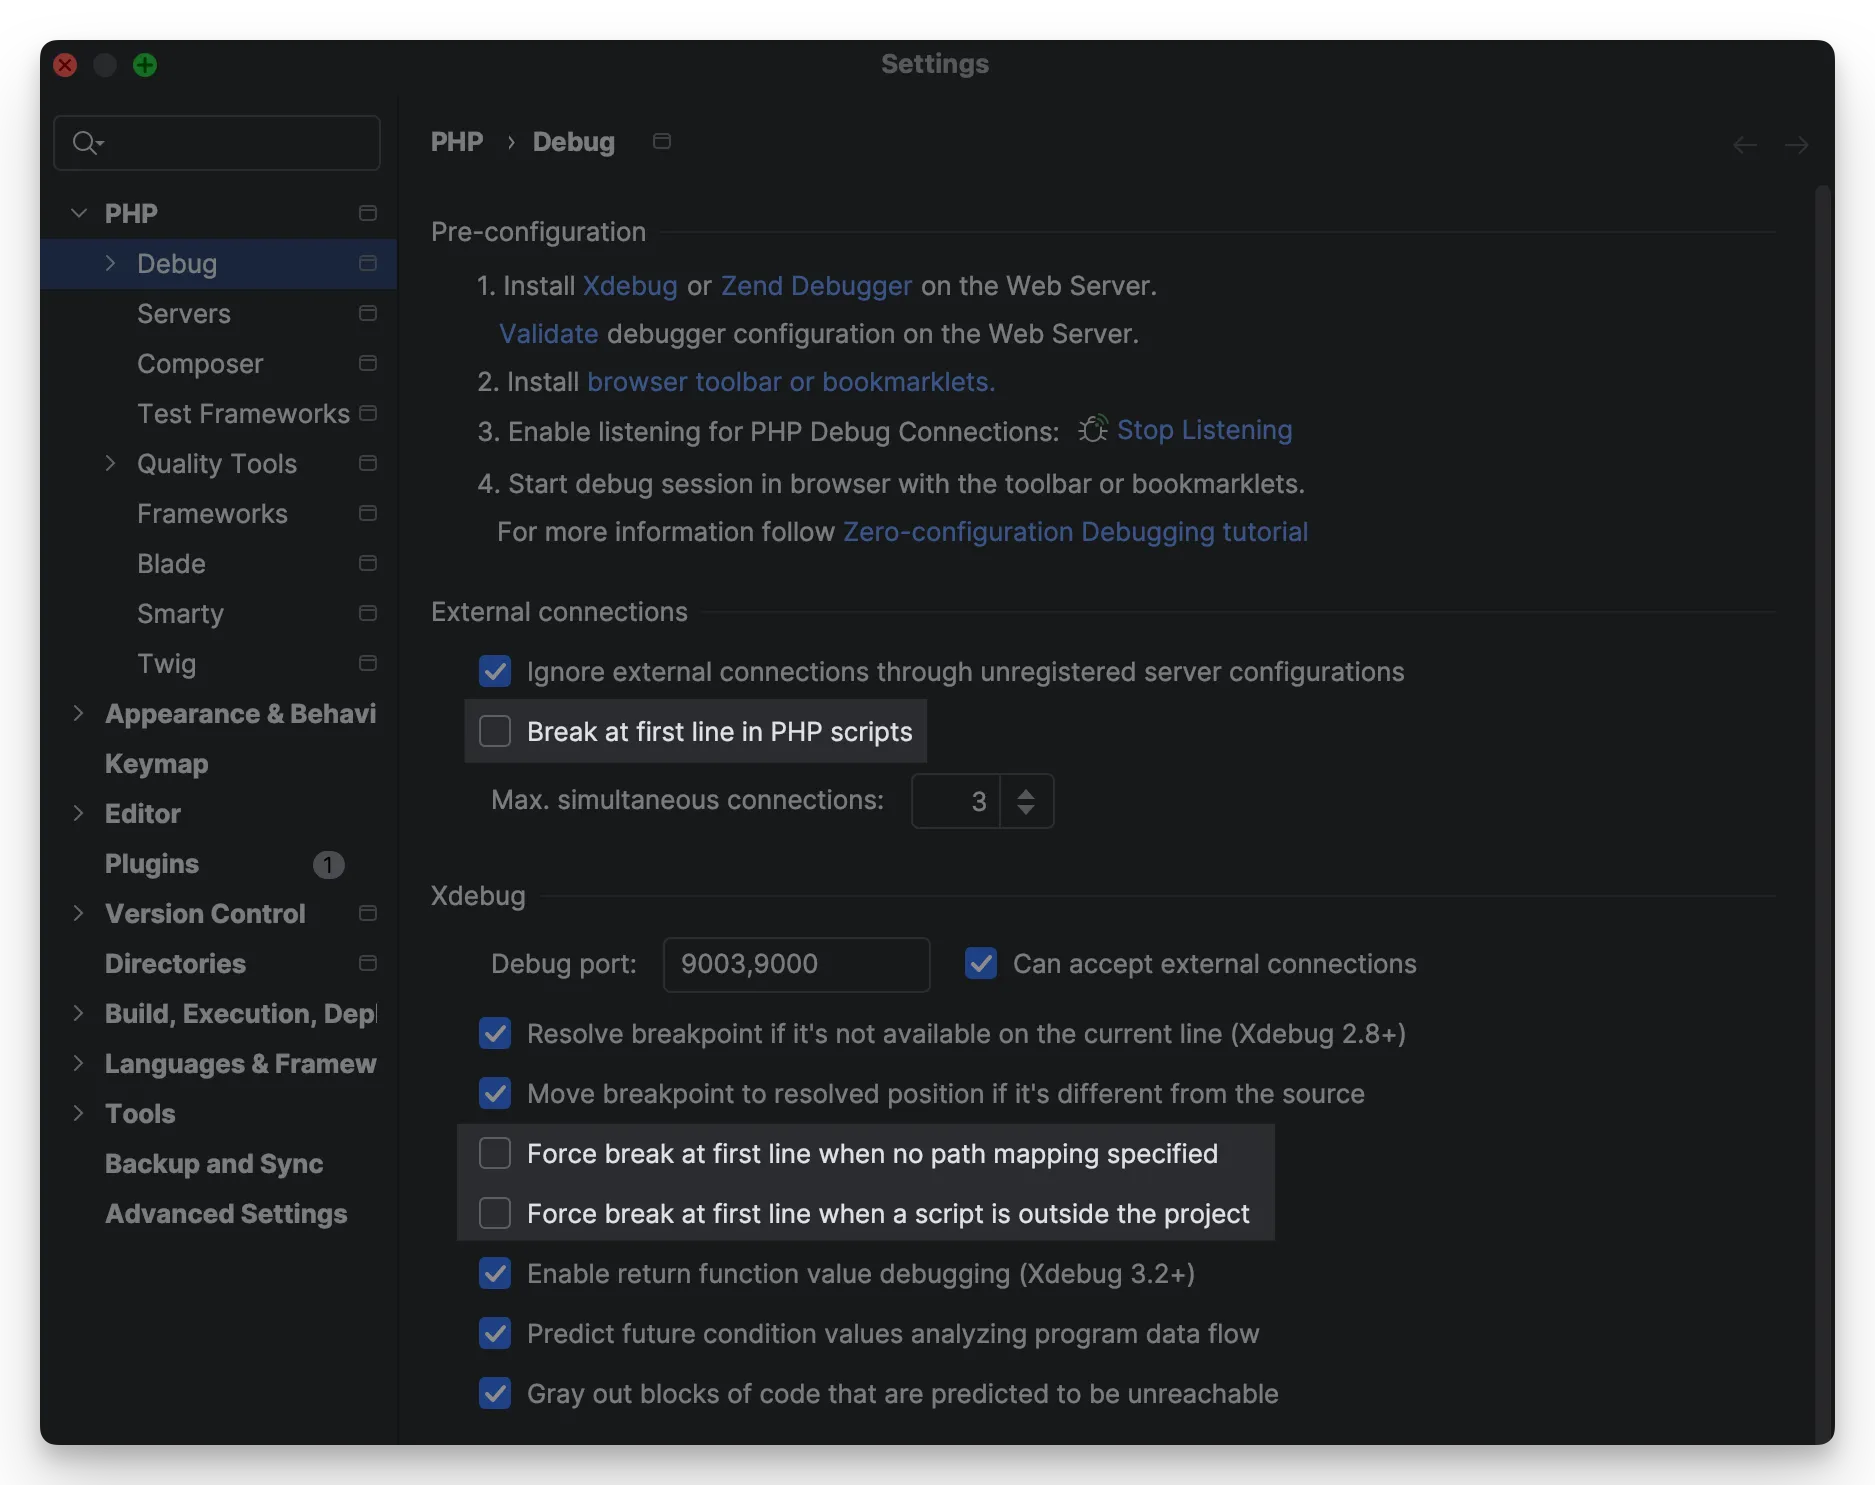
After you’re done, the configuration should look like in the screenshot above.
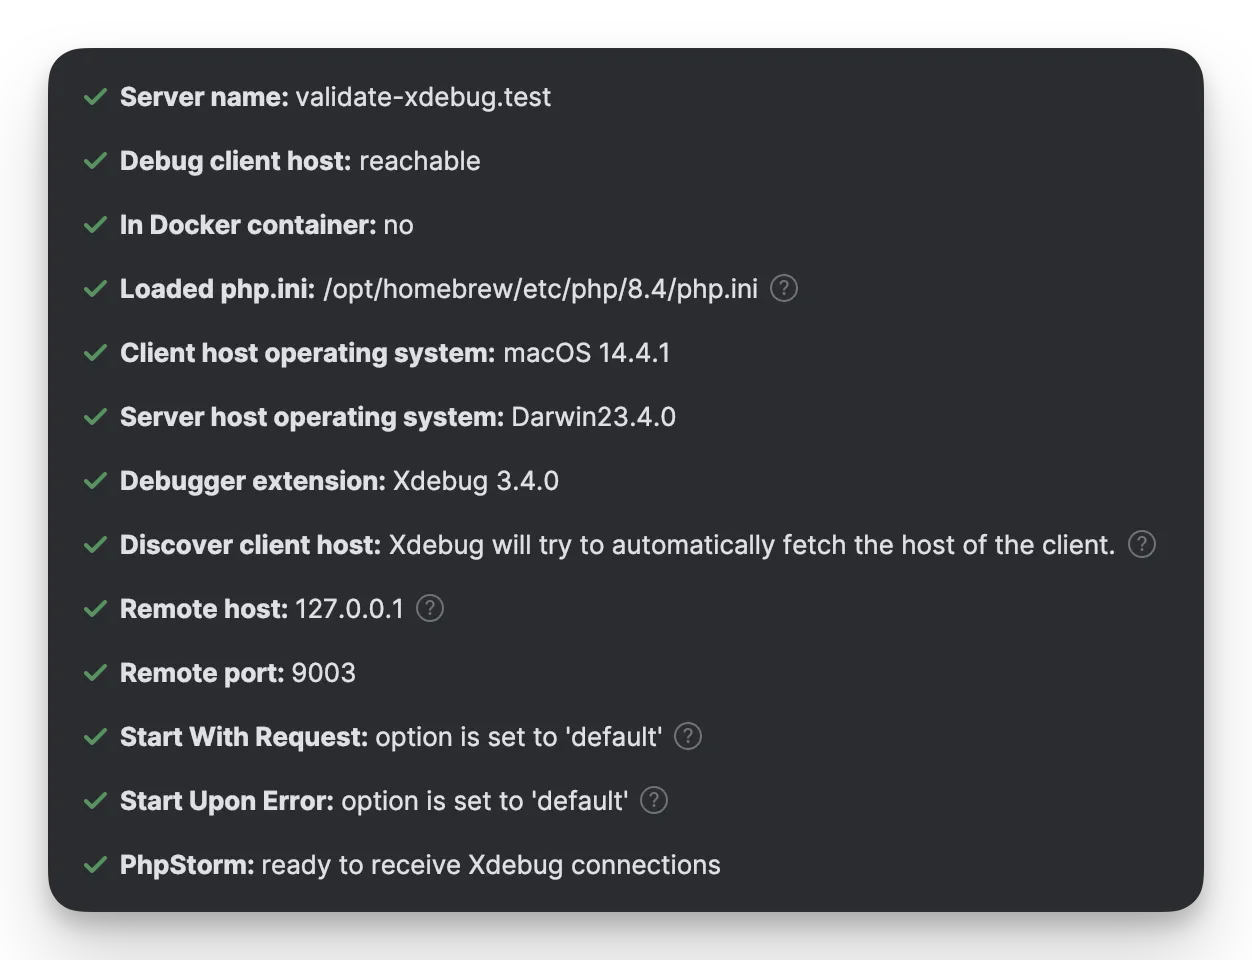
Validate PhpStorm Debugger Configuration
Now that everything’s setup, it’s time to validate the debugging capabilities of PhpStorm to make sure that everything was set up correctly.
Go back to the Debug section under the PHP category in your PhpStorm’s settings. At the top, you can find a multi-step pre-configuration guideline.
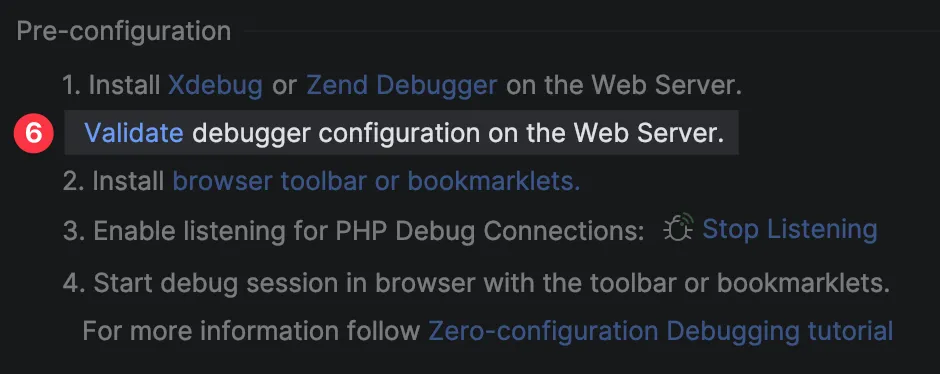
Locate the Validate link in the second line of the first step and click on it.
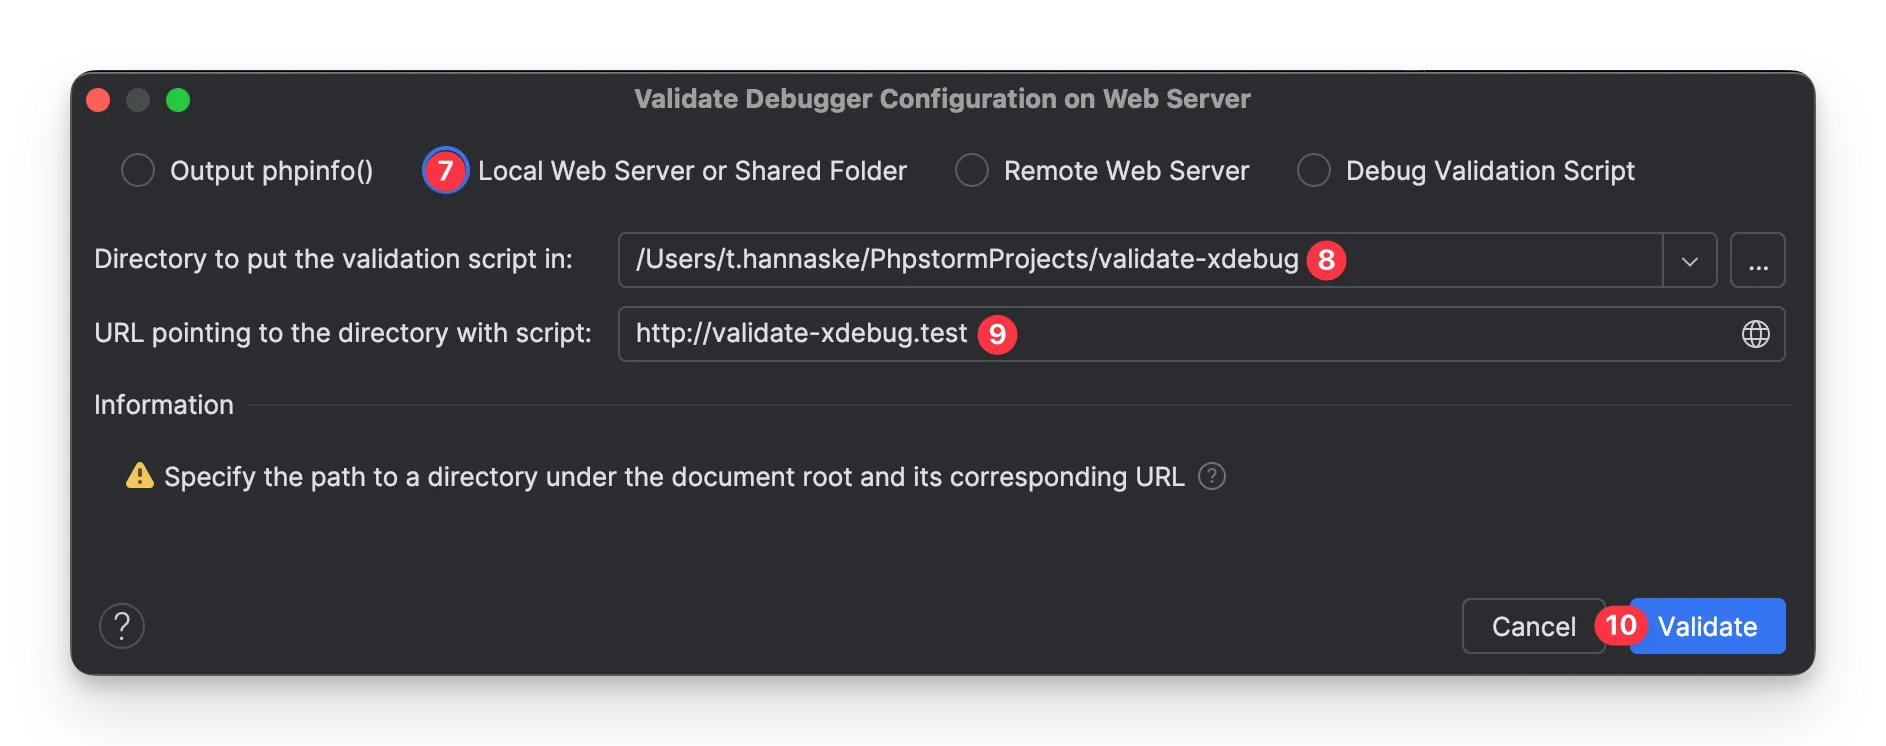
Select Local Web Server or Shared Folder and choose an empty directory within the serving path of your Valet installation. I did provide my PhpstormProjects folder as Valet directory, therefore every project I create is automatically available in the browser. Once you’ve created and selected said empty directory, provide the local address to that directory below. As you’re using Valet, this is just the name of the directory with .test at the end.
Finally, click Validate and the result should be all-green.
Disable Path-Mapping
As you’re using Valet to locally access your projects with a .test top-level-domain in your browser, PhpStorm unfortunately thinks, that you are using a remote development environment and therefore wants you to enable path mappings. However, to properly work, you need in fact to turn said path mapping off, otherwise the debugger is unable to correlate the incoming request with the file in your PhpStorm.
Start a debugging session
At this point, you’re already done with setting up Xdebug and PhpStorm. Now you can start debugging. There are basically two ways to do this, one of which is more comfortable but involves installing a browser extension. Ultimately, it’s up to you which path you’re choosing.
Again the reminder that you need to repeat the steps for XDebug in PHP Monitor for every PHP version you’re planning to use Xdebug with.
Before you start, enable PHP debugging in PhpStorm by going to Run -> Start Listening for PHP Debug Connections. This will make sure that PhpStorm will connect to Xdebug to be ready to initialise step-by-step debugging through your code, once you trigger a debugging session or a debugging request.
XDebug Trigger
The first of two methods is the XDebug Trigger method which is the manual way to get Xdebug and PhpStorm to initialise a debugging session. Given our current Xdebug configuration, this is quite simple and works by adding a specific GET or POST parameter to the request you want to debug. The parameter depends on whether you want to trace a single request or start a whole debugging session. The latter will cause your browser to have a cookie set that will trigger a debugging session for each subsequent HTTP request being made to your application until the cookie is being removed.
| Trigger Parameter | Description |
|---|---|
XDEBUG_SESSION | Only debug a single request |
XDEBUG_SESSION_START | Debug all subsequent requests |
The value you assign to the GET or POST parameter doesn’t matter, but you could theoretically configure Xdebug to only care for a certain value if you’d want this for any reason.
So, if you’re visiting https://my-application.test/auth/login, all you need to do to debug that single request being made is to open https://my-appliction.test/auth/login?XDEBUG_SESSION=1 in your browser.
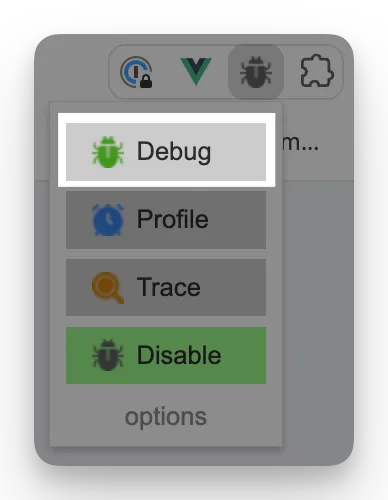
Browser Plugin
The “more comfortable” version of this is using the official JetBrains extension for the browser of your choice.
| Browser | Download |
|---|---|
| Chrome (or Brave or any other Chromium-based browser) | Xdebug Helper by JetBrains |
| Firefox | Xdebug Helper by JetBrains |
| Edge (Please don’t) | XDebug Helper |
Once installed, you have a small dropdown in your extension menu where you can click Debug to enable debugging for subsequent requests. Under the hood, it basically does the exact same as you’d do with the manual trigger.